
Every day at 5pm I would listen in to the daily briefing by the DG Health Ministry. Although I applaud the efforts being done by the Ministry, I should caution against any form of optimism. Today, 12 April 2020, is no different. It is the 26th day of the Restricted Movement Order.
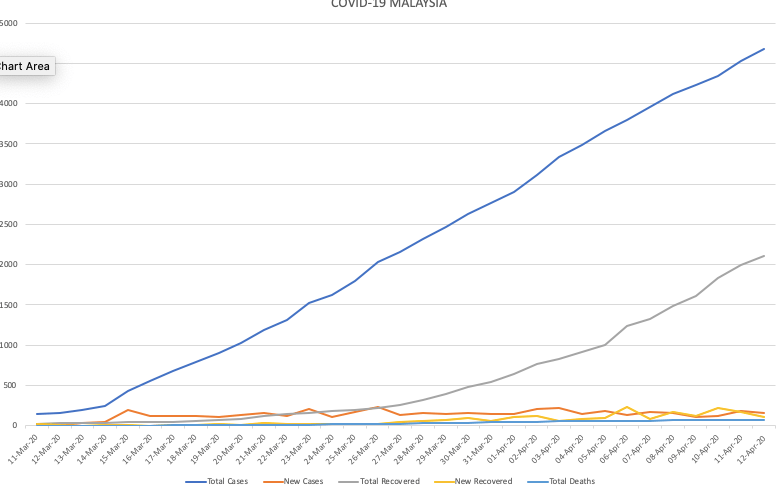
In the first graph, the blue line at the top represents total number of cases while the grey line beneath it represents total number of those who have recovered. Optimally, we should see the blue line tapering and flattening, the grey line showing exponential increase whilst decreasing the gap between the two. It is only when the blue line flattens and the grey line crosses it could be breathe a sigh of relief. Unfortunately, that hasn’t happened.
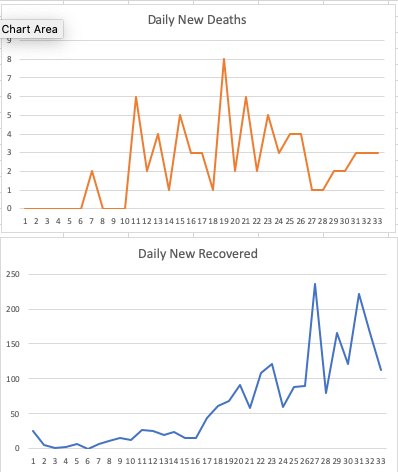
In the second graphs, you can see that the number of daily deaths is showing a steady increase while those who have recovered daily is going on a downward trend. Our percentage of deaths have increased from 1.58 percent to 1.62 percent of total cases.
Sure, today we also saw a drop in the number of daily new cases, but we are still getting at least 150 new cases daily. And there still are thousands of results pending, and I am sure a huge number of those with the virus still undetected.
If anyone is optimistic that we are winning the war, that certain sectors of industries ought to be allowed to operate, or that internal borders should be re-opened to allow movements, think again.
This war is far from over.

You must be logged in to post a comment.